
Reading time: 20 minutes
Key Takeaways
- Between 2022 and 2023, the gap between the housing we have and the housing we need narrowed by about 70,000 homes, the second year in a row of modest improvement.
- In 2023, modest positive gains in housing production in Western states began to reverse, and the gap between housing supply and demand started to grow again.
- New housing permits have been in steady decline since 2022, and macroeconomic factors, such as high interest rates, constrained labor markets, and tariffs, are likely to pose significant challenges to meeting America’s housing needs.
Housing Gap in 2023: 3.78 Million
National Housing Underproduction
| 2019 | 2021 | 2022 | 2023 |
| 3.79 Million | 3.89 Million | 3.85 Million | 3.78 Million |
Trends in Metropolitan Markets Since 2012
| 72 Markets
Underproduced in 2012 and have worsened |
23% of Metros |
| 109 Markets
Adequately produced in 2012 and are now underproduced |
35.3% of Metros |
| 69 Markets
Adequately produced in 2012 and are trending toward underproduction |
22.3% of Metros |
| 11 Markets
Underproduced in 2012 and have reached adequate housing production |
3.6% of Metros |
| 14 Markets
Underproduced in 2012 and are in the process of recovering |
4.5% of Metros |
| 34 Markets
Adequately produced in 2012 and have continued to meet or exceed housing need |
11% of Metros |
Summary
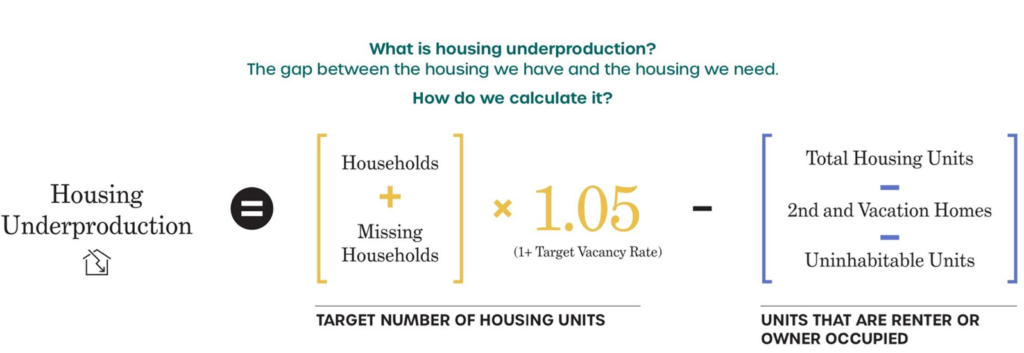
For the second year in a row, housing underproduction—or the gap between the housing we have and the housing we need—has narrowed, from 3.85 million homes in 2022 to 3.78 million homes in 2023. Nationally, increased housing development from 2022 to 2023, paired with stabilization of the atypical internal migration and remote work trends of the COVID-19 era, helped reduce the overall housing gap by 70,000 homes. Regional trends also shifted. Data released in 2022 showed underproduction narrowing slightly in West Coast states while housing supply challenges grew in the middle of the country. But by 2023, these domestic migration patterns had stabilized (Frey, 2024). While the national housing shortage has become slightly less severe, permitting data indicate that even the modest progress from recent production spikes is in jeopardy.
What’s Driving the Changes?
The modest improvement in regional housing market conditions can be linked to concurrent increases in supply and reductions in demand in urban centers. Pandemic-era out-migration from more expensive coastal areas to places like Montana and Arizona reduced demand. At the same time, housing starts and unit deliveries were strong across many of those same metro areas. High levels of permitting activity in 2022 (Jones, 2024) ushered in a 15-year production high of single-family detached homes and the highest new apartment construction since 1987 (Up for Growth, 2024).
But by 2023, these domestic migration patterns had stabilized, and new housing permits declined (Frey, 2024; Jones, 2024). Modest gains in coastal urban centers had stabilized or reversed, and the housing gap in middle and sunbelt states continued to worsen. Adding to the strain, new household formation has steadily ticked up for three consecutive years, indicating that the factors that once encouraged adult children to stay in their parents’ home, or individuals to share rent with one or more roomates, are shifting. Moreover, by the summer of 2025, permits to build new apartment buildings dropped by 23% from the pandemic’s peak, single-family housing starts were down 6%, and permits for future single-family homes also declined by 2% (Katz, 2025; U.S. Census Bureau, 2025b).
Housing Permits Over Time (2020–2025)

Future Outlook
As housing permits continue to decline, and housing underproduction holds steady around 4 million homes, housing availability and affordability are expected to remain a top challenge for families. The typical mortgage payment has increased by nearly $1,000 since the COVID-19 pandemic began. Between 2019 and 2024, median home sale prices had risen 60%, with single-family homes hitting a high median price of $412,500 and more than 50% of renters suffering from cost-burdening (Joint Center for Housing Studies at Harvard, 2025). Today, a median-income family needs an 18% drop in housing costs or a 2% or more interest rate drop to afford to purchase a home (Prakash, 2025). In some of the largest metropolitan areas, including New York and Los Angeles, mortgage interest rates could drop to 0%, and a family earning the median area income would still be unable to afford purchasing a home (Haag, 2025).
Contributors to Chronic Housing Underproduction
| Bricks | Material barriers: volatile prices, fragile supply chains, and outdated codes that raise costs and constrain adoption of modern building methods. |
| Bucks | Capital constraints: limited credit, high financing costs, and weak incentives in distressed markets that prevent otherwise viable projects from moving forward. |
| Land | Access to sites and entitlements: restrictive zoning, infrastructure gaps, environmental reviews, and community opposition that limit where homes can be built. |
| Labor | Workforce bottlenecks: shortages of skilled trades, weak training pipelines, and low productivity that slow construction and increase costs. |
| Political | Resistance to new housing: organized NIMBY opposition, misinformation, and misaligned electoral incentives that discourage leaders from approving homes. |
| Process | Administrative friction: duplicative reviews, long permitting timelines, fragmented jurisdictional authority, and litigation that delay or derail projects. |
Conclusion
The data make clear that while recent gains in housing production have helped narrow the national housing shortage slightly, these improvements are fragile. Declining permits and persistent structural barriers across land use, labor, materials, and capital markets threaten to erase progress. Ensuring continued momentum will require deliberate action to reduce these barriers and create more predictable, scalable pathways for new housing production. Addressing the drivers of underproduction is essential to ensure affordable and accessible housing to people across the nation.
References
- Frey, W. H. (2024, May 16). Recent immigration brought a population rebound to America’s major metro areas, new census data show. Brookings Institution. https://www.brookings.edu/articles/recent-immigration-brought-a-population-rebound-to-americas-major-metro-areas-new-census-data-show
- Haag, M. (2025, August 28). Mortgage rates, home prices, and affordability. The New York Times. https://www.nytimes.com/2025/08/28/realestate/mortgage-rates-home-prices-affordability.html
- Horowitz, A., Su, D., & Rodnyansky, S. (2025, July 31). New housing slows rent growth most for older, more affordable units. Pew Charitable Trusts. https://www.pew.org/en/research-and-analysis/articles/2025/07/31/new-housing-slows-rent-growth-most-for-older-more-affordable-units
- Joint Center for Housing Studies of Harvard University. (2025). The state of the nation’s housing 2025. Harvard University. https://www.jchs.harvard.edu/sites/default/files/reports/files/Harvard_JCHS_The_State_of_the_Nations_Housing_2025.pdf
- Jones, Hannah. (2024, February 27). US housing supply gap grows in 2023; Growth outpaces permits in fast-growing sunbelt metros. Realtor.com. https://www.realtor.com/research/us-housing-supply-gap-feb-2024/
- Katz, L. (2025, August 14). Permits to build U.S. apartments have fallen 23% since the pandemic construction boom. RedFin. https://www.redfin.com/news/multifamily-building-permits-august-2025/#:~:text=As%20a%20result%2C%20the%20number,seeing%20a%20decline%20in%20permits
- Prakash, A. (2025, June 29). Rate, price drops won’t substantially improve affordability. Zillow. https://www.zillow.com/research/rate-drops-35389/
- Up for Growth. (2024, October). Housing underproduction in the U.S., 2024. https://upforgrowth.org/wp-content/uploads/2024/10/2024_Housing-Underproduction-in-the-U.S.-Report_Final-c-1.pdf
- U.S. Census Bureau. (2025a). Current data. New residential construction: building permits. [data set]. https://www.census.gov/econ/currentdata/?programCode=RESCONST&startYear=2020&endYear=2025&categories[]=APERMITS&dataType=TOTAL&geoLevel=US&adjusted=1¬Adjusted=0&errorData=0#line067
- U.S. Census Bureau. (2025a). Current data. New residential construction: building permits. [data set]. https://www.census.gov/econ/currentdata/?programCode=RESCONST&startYear=2020&endYear=2025&categories[]=APERMITS&dataType=TOTAL&geoLevel=US&adjusted=1¬Adjusted=0&errorData=0#line067